Simultaneous thermogravimetric analysis (STA) is a thermal analysis technique that most commonly combines thermogravimetry analysis (TGA) and differential scanning calorimetry (DSC) in a single instrument for simultaneous measurement. A good way to describe an STA is that it’s the multitool of the thermal analysis world.
For this article, we’ll use the TGA and DSC combination to provide our explanation.
TGA measures the sample weight changes whilst DSC measures the heat flow of a sample over a temperature range whilst differential thermal analysis (DTA) measures the difference in temperature between a sample and a reference material over a temperature range. In a nutshell, a DSC is a DTA which has been calibration for quantitative enthalpy measurements. Most STAs are TGA/DTA and some are also capable to be used as a DSC.
By combining different measurement techniques, variety of information can be achieved from one sample.
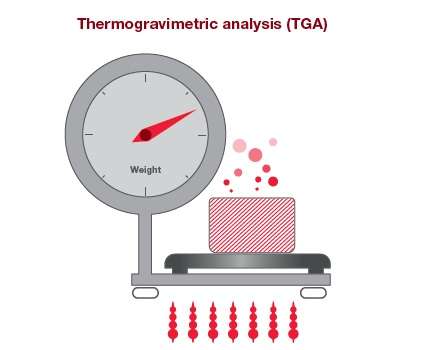
Thermogravimetric analysis is when sample is placed in a furnace on a highly sensitive balance. The mass of the sample is monitored against time or temperature in oxidative or an inert atmosphere.
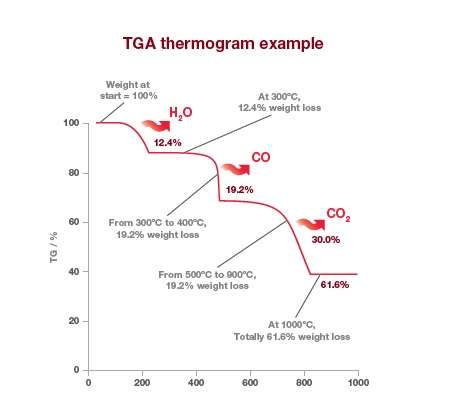
The change in mass of the sample is plotted against time or temperature. The percentage reduction in mass at given temperatures can be clearly seen in the TGA thermogram of calcium oxalate below.
TGA alone can give you information on moisture content, residual solvents, and the amount of desorbed or decomposed components emitted at given temperatures or over a certain period of time. With STA you get more complete thermal information about your sample, including exothermic and endothermic events. Here’s a typical STA output trace for PET.
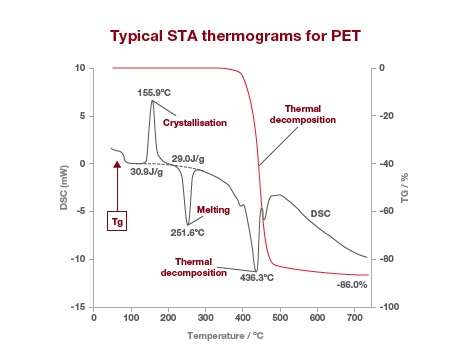
The DSC signal is shown in grey and the TGA signal in red. The DSC results show the calorimetric analyst for glass transition, crystallization, fusion and any other endothermic or exothermic reactions whereas the TGA signal shows the weight change by thermal decomposition.
In TG (thermogravimetry), the temperature dependence of weight changes caused by phenomena such as decomposition, oxidization, dehyhdration, heat resistance, evaporation and kinetic analysis can be determined.
In DSC (differential scanning calorimetry), you can measure glass transition, melting, crystallization, specific heat capacity (Cp), chemical reactions such as thermal curing and extra information on TGA weight loss/gain by finding out if they are exothermic or endothermic processes. thermal history, specific heat capacity (Cp)
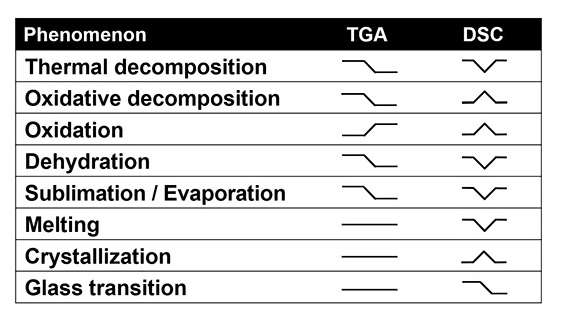
The table below shows the type of TGA signal you will get from different phenomena and the extra DSC information you will get from a STA.
We’ve picked ASTM E2550-11, the standard test method for thermal stability by thermogravimetry as our example. This test method covers the assessment of material thermal stability through the determination of the temperature at which the materials start to decompose or react and the extent of the mass change using thermogravimetry.
The test method uses minimum quantities of material and is applicable over the temperature range from ambient to 800°C. The absence of reaction or decomposition is used as an indication of thermal stability in this test method under the experimental conditions used.
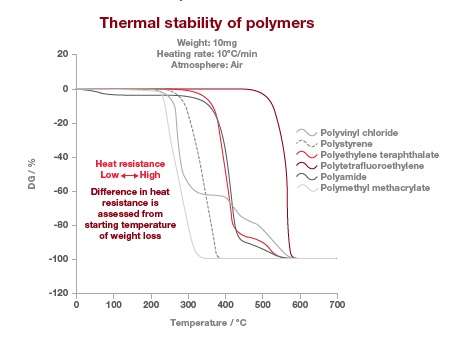
This test method may be performed on solids (beads, film or powder) or liquids, which don’t sublime or vaporize in the temperature range of interest. The TGA thermograms below are showing the thermal stability of different type of polymers. In this example, the stability of the polymer can be observed where there is no weight loss. The temperature at which the polymers lose their thermal stability is measured at the intercept of the baseline and where the weight loss is happening the fastest.
In this example, the most stable polymer is the polytetrafluorethylene (PTFE) and the least stable is the polymethyl methacrylate (PMMA). It’s also worth noting that the polyamide weight loss at around 100°C is due to water loss and not due to thermal stability.
Using STA means you get two experiments in one with identical parameters for both data sets to eliminate uncertainty that could come from sample preparation and differing instruments. Both data sets are also collected on the same sample in the same furnace with same gas flow to give better correlation of time/heat flow and time/mass change phenomena in time-sensitive operations.
STA instruments are suited for research and routine applications in polymers, food, pharmaceuticals, nanomaterials, metals and oil as it combines analysis techniques within one instrument.
Our NEXTA STA instruments enable the detection of minute weight changes over a wide temperature range, ensuring the material meets performance and quality standards required. Depending on the ambient temperature you’re after, our STA200, STA200RV and STA300 will help to ensure your material meets the performance and quality standards required.
Our innovative Real View® camera system integrates seamlessly with NEXTA STA Series to observe changes in the sample status during analysis in real-time. Images reveal changes in sample shape, size, colour, and other properties. The images can be recorded and are automatically linked to the thermal data by timestamp. You can also integrate RealView® with the Auto Sampler to monitor changes to your samples while automatically analyzing several samples at once.
Watch our expert James Bennett give a demo of a STA
Discover moreYou might also be interested: