Plastic gets a very bad press. With over 380 million tons produced every year and almost 60% of this discarded as waste, plastic is literally collecting in our landfill sites and oceans with disastrous results. However, at a time when cutting emissions is essential to prevent runaway climate catastrophe, plastic can help lower harmful greenhouse gases by reducing shipping weights, improving fuel efficiency of vehicles, and keeping food fresh.
In fact, recent documentation from Canada recognizes that the problem with plastic is an issue of mismanagement of plastic waste, and that as a material, plastic has many positive aspects in relation to the environment as mentioned above.

Currently, only ‘’16% of plastic waste is recycled to make new plastics’’ is recycled. The rest is incinerated, sent to landfill, or illegally dumped where it often ends up in the sea. The problem with recycling is complex; with the price of crude oil fluctuating and the recycling process relying on hand-sorting of waste. Sometimes it’s simply cheaper to create new plastics rather than recycle old ones. Many plastic products contain a mix of plastics or additives, making them too complex for recycling, and even if you are sure of the composition, you can’t be sure that the recycled plastic behaves exactly as virgin material. Recycled goods may have been exposed to rain, UV radiation and heat, all of which can change the material characteristics when compared with virgin plastic.
The good news is that the percentage of plastic that’s being recycled is increasing. But our global use of plastic is also increasing – at an alarming rate – meaning that every year more plastic waste is discarded, despite a higher recycling percentage.
The solution to this global problem is complex, but simple techniques that can quickly and accurately determine the composition and potential performance of recycled material will help production facilities use more of the recycled material available. And this is where thermal analysis plays its part.
Within the plastics lifecycle, thermal analysis can be used in three main ways:
You can see that if you are using recycled plastics, thermal analysis will help solve the problems associated with using them. You can determine exactly what type of plastics you have and in what quantity, and check performance characteristics against either specified products or new polymer development.
Now, let’s look at specific examples of thermal analysis in the plastics lifecycle.
Example 1: DSC for raw material identification
This example allows you to check the polymer type of recycled raw materials. Using a differential scanning calorimeter, you fingerprint the materials by determining the glass transition and melting points.
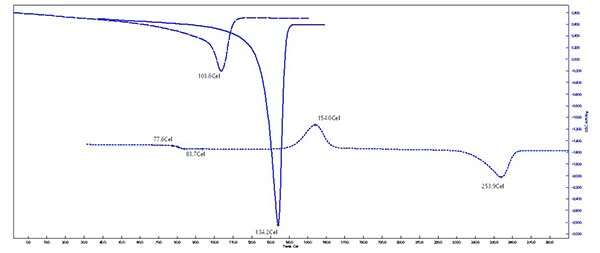
You can compare the values for melting temperature and / or glass transition with known values to verify the polymer type. In this example, we’ve used our NEXTA DSC200 instrument.
Example 2: DSC for checking for impurities
Now we’ll look at an example that’s a little less straightforward. Any impurities within the recycled polymer will affect its properties, so DSC can be used to check for minute amounts of unwanted material. In this example, we’ve tested HDPE with 0.5% PP to illustrate how the small amount of PP can be picked up during a measurement.
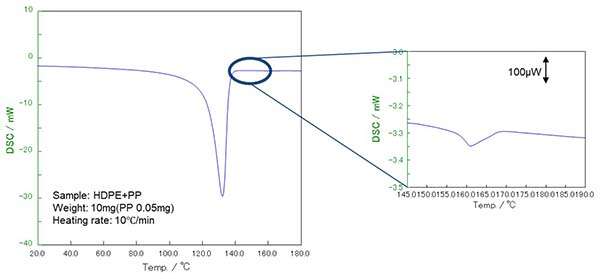
In this case, we’ve used our NEXTA DSC600, which has a higher level of sensitivity at 0.1 µW. This is needed for this type of measurement where the impurity level is very low. The two types of polymers have very different melting points, so you can easily see the peak for PP at this level of sensitivity.
Example 3: TGA to check stability of recycled plastic
Another characteristic of a recycled polymer that you might want to check is stability. This could be for final product use if the material is for a high temperature environment, but also whether the material could withstand your own production processes. Here, we’ve used the TGA function on our simultaneous thermogravimetric analyzer, the NEXTA STA200RV. We’ve analyzed three types of PET: 90% recycled, 60% recycled and 0% recycled.
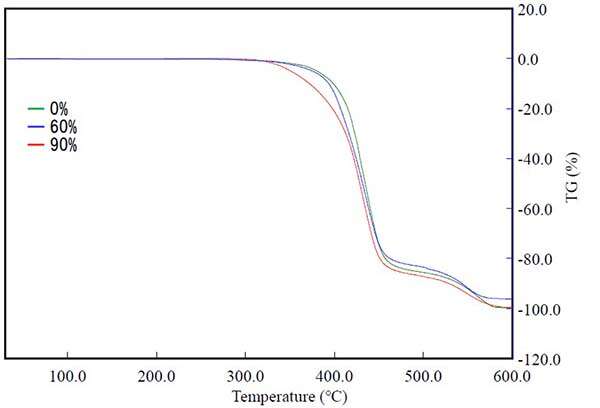
The graph shows that the recycled material has lower stability and starts to decompose at a lower temperature than the virgin material. The higher the percentage of the material, the lower the temperature at which this occurs. You can then compare this with the temperature reached during production and decide on the suitability of recycled material.
Example 4: Can you use re-ground parts in production?
This scenario is more to do with cutting waste and saving costs in production. The question is whether you can feed the waste from your production back into your process. Key things we’re looking for are whether the composition changes at all between organic and inorganic components of the polymer. STA / TGA will give you an idea of any compositional change.
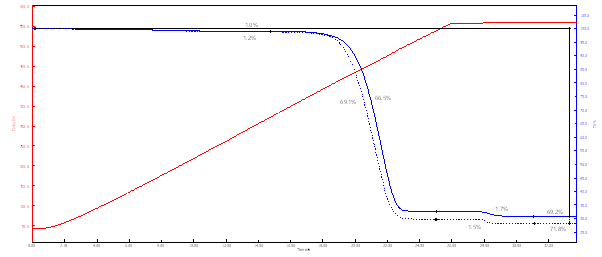
From the graph, you can see a difference between the solid line (virgin material) and the dotted line. This difference between 500ºC and 550ºC shows a lower concentration of inorganic material, which is fiberglass, in the re-used sample.
However, to determine whether this is a problem in the final product application, we’ve used our unique RealView system, which allows you to see what’s going on with the sample during the scan.
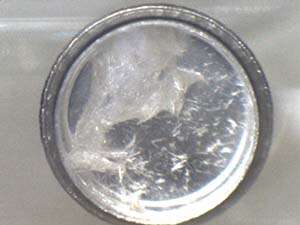
Virgin material
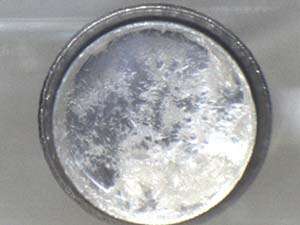
Re-ground material
These images give you extra information. For example, you can see that there is less glass fiber in the re-ground material and, of what does remain, the fibers are smaller than in the virgin sample. This is just one example of where RealView technology gives you a more comprehensive picture than the graphical output alone.
Find out more…
For more information about how Hitachi’s range of thermal analyzers can help you use more recycled plastic in your production you can watch our webinar on How thermal analysis can lead to a better future for plastics and the planet or get in touch to discuss your specific application.
Get in touch