Hitachi’s unique Real View® camera system allows you to see what’s happening visually to your sample as you run a thermal analysis measurement. If you have ever completed a DSC, TGA, or DMA analysis and the output curve wasn’t what you expected, or you can see after the experiment that the sample has changed color but you’re not sure when, then you’ll already know that being able to see what’s happening to the sample during the temperature change is a real advantage. It’s also a great way to teach someone about thermal analysis as you can see what is happening during analysis. Ideal for academia and people without thermal analysis knowledge, it helps users understand what is happening during measurement.
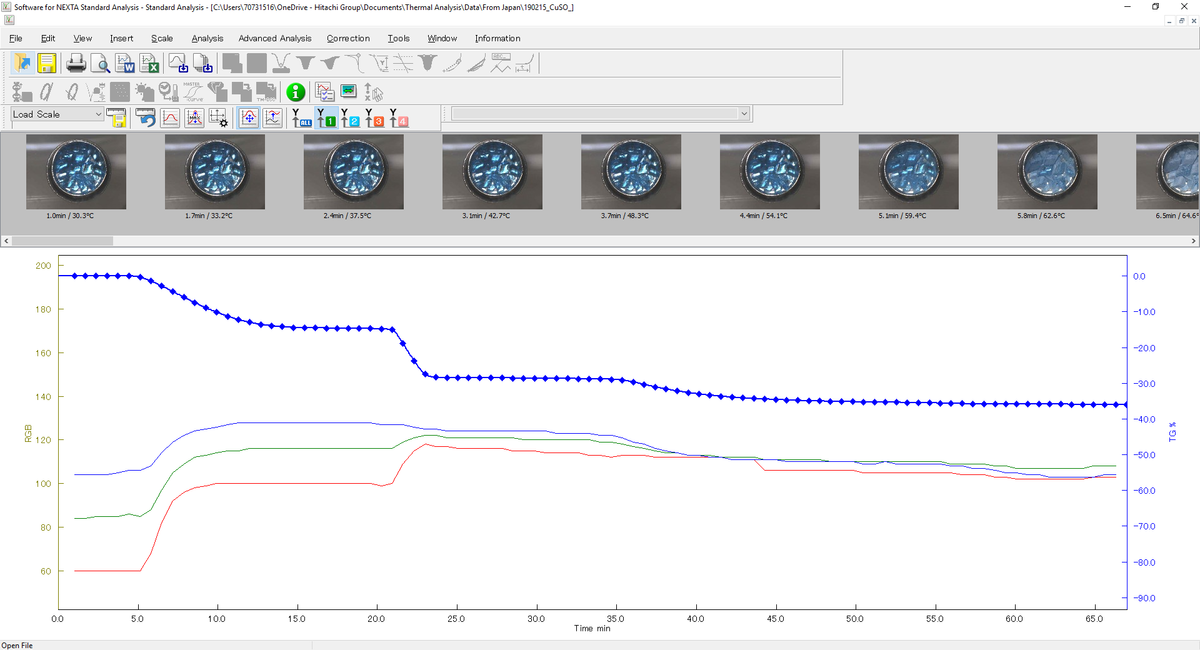
The Real View® system records images of your sample at pre-set intervals throughout the thermal analysis measurement. Images are recorded with your thermal analysis results which makes it easy to correlate images with a point or a section of the thermogram. The NEXTA TA software allows you to seamlessly work with your results and images collected. You can pinpoint anomalies on the graph and match these to the image of the sample. You can also run a video of the entire measurement; this allows you to easily share results with colleagues, students and customers.
To illustrate how the Real View camera makes such a difference to your thermal analysis, let’s look at a couple of examples:
Uncured and cured epoxy samples were analyzed using thermogravimetric analysis from room temperature to 500ºC. You can see from the thermograms below that there is an unexpected feature on the output graph at 400ºC from the cured sample results.
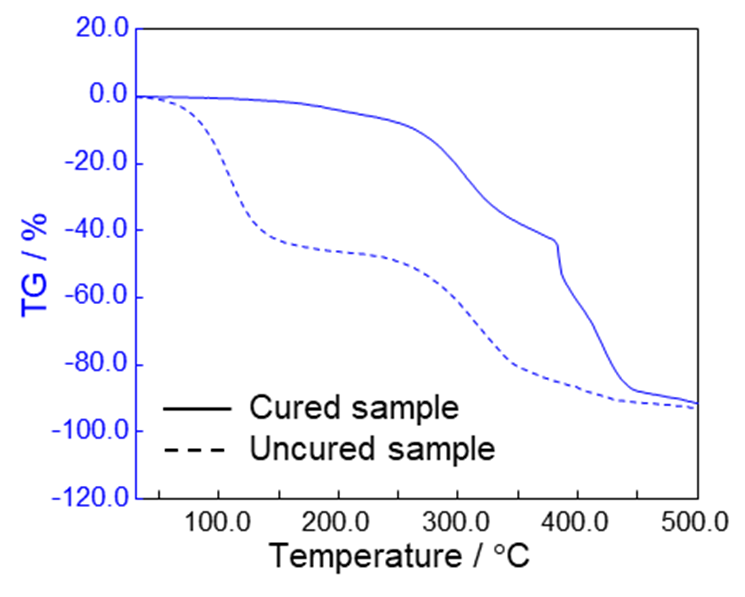
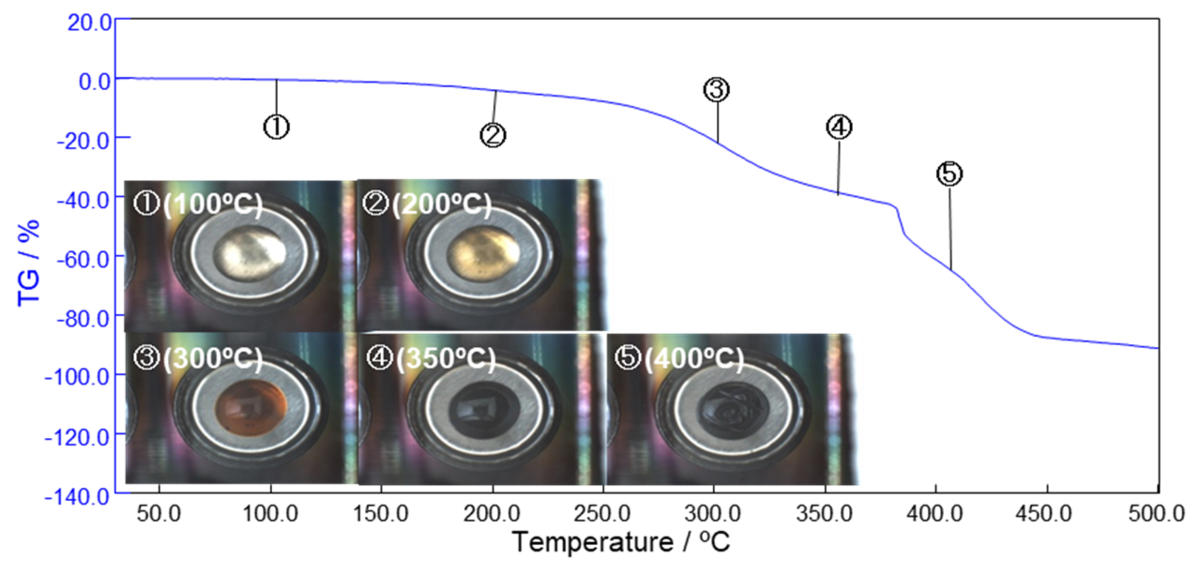
Without Real View® you would have to rely on an experienced analyst, or you would have to re-analyze the samples to know if it was a real feature or just an artifact. Real View® shows you that this anomaly is due to the quick loss of gas trapped in the sample which burst out of the sample to form. The bust bubble made the sample move and this created the bump in the TGA result. Knowing this saves you from running multiple experiments to investigate the issue.
Not all sample degradation mechanisms show thermal reactions or sample weight loss. This means that running experiments in a classic DSC or STA might not give you the complete picture of what’s going on. If the final color of your product is important, you could do a TGA measurement to see if the sample changes color over a temperature range and if it has the expected stability. Only Real View® allows you to monitor the color change throughout the whole experiment, allowing you to know exactly when it is changing color. This will allow you to make sure you have the right amount of antioxidant or to set up your production line at the right temperature to avoid a color change. Real View® helps in cases like this because you can really home in on minute changes in color – even when it’s hard to detect by eye. It also helps to prevent human errors as we all see color differently. Therefore, Real View® color measurement using RGB, Lab or CMYK allows an precise and accurate color measurement.
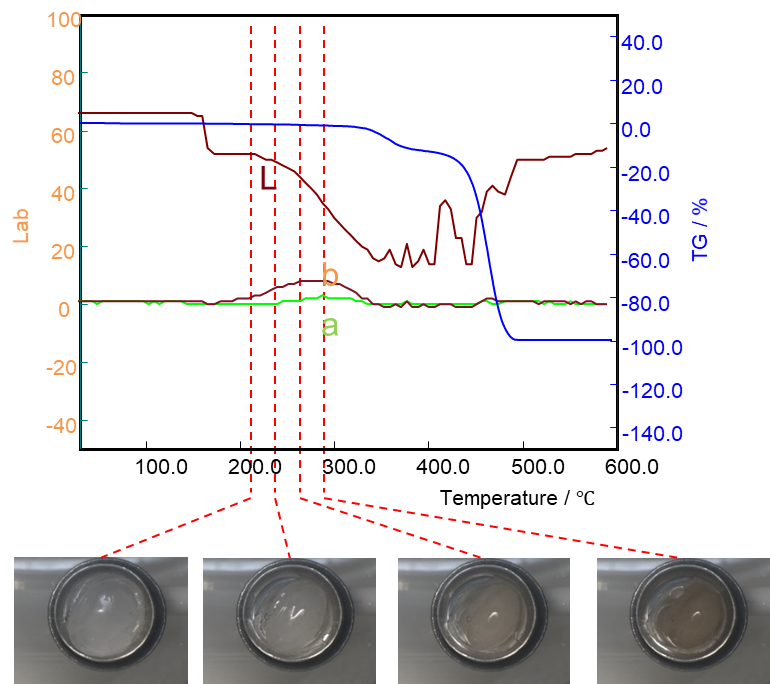
In the results above, polypropylene with 10% cellulose nanofiber was heated to 600ºC in a TGA analyzer with Real View enabled. Using Lab analytical mode, we can see that ‘b’ (the yellow) index increased between 200ºC and 300ºC. The TG signal didn’t change during this time, but the color change tells us exactly where the sample degradation occurred.
Real View® is included as an option on our NEXTA DSC, NEXTA STA and DMA200 thermal analyzers and can be included at the point of sale or bought as an upgrade. Its effectiveness is down to several design elements: the camera, the window between the camera and the furnace and the software.
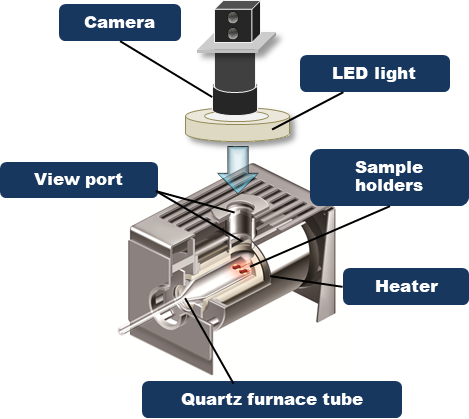
The camera is selected to give excellent image quality and good depth of field. This is important as the sample may not be homogeneous, and you’ll want all of your sample to be in focus for effective post-measurement analysis. Also, we’ve included an optimized lighting system within the chamber to ensure you can see every detail. The camera can also capture video, as well as image stills, allowing you to run a visual replay of the measurement.
On our NEXTA DSCs, we’ve achieved a temperature range of -50ºC to 300ºC over which you can capture images. Sub-zero temperatures are possible thanks to a localized heating system that prevents the window from icing up.
The software included with the Real View® unit is extremely powerful, and as we’ve seen from the examples above, its functionality supports advanced problem-solving. Probably the most important feature is that each image (or video) is stored alongside time and temperature information. This means that when looking at an output graph, you can bring up an image for each point to determine exactly when the sample changed size or color. Further software capability includes RGB, CMYK and Lab color analysis. You can split the output graph into RGB sections to investigate subtle color changes within the sample. It also allows you the easily customize and correct images as well as create videos which can be shared with anyone you like.
To find out more about how Hitachi’s unique Real View® system delivers visibly better thermal analysis for a range of applications, get in touch.
Find out more Get in touch