How do you like your chocolate? Extra creamy or more on the brittle side? Should it melt in the mouth without making a sticky mess in your hand? Everyone knows what to expect from their favourite chocolate. So much so entire marketing campaigns are devised around the texture and behaviour of the treat. Try changing the type of chocolate used in your product and you could experience a serious backlash (see the Cadbury’s Creme Egg scandal of 2015[1]).
Getting the chocolate right for every batch comes down to quality control. Not that straightforward for food manufacturers, as the properties of chocolate are affected by extremes of storage temperature. This is why the thermal analysis technique of differential scanning calorimetry is such a useful technique for testing chocolate.

Differential scanning calorimetry is part of the thermal analysis family and is a simple yet elegant method for characterising chocolate by analysing its response to changes in temperature. The results, based on cacao butter content, give you important product information, such as melting temperature, crystallization, storage stability and texture.
To illustrate this, the green curve on in Figure 1 shows a typical DSC thermogram for creamy chocolate. Here, you can see valleys (endothermic peaks) that correspond to melting peak temperatures of 10ºC and 28ºC. This tells that in this case, most of the fat will be melted just above room temperature and the chocolate will have a creamy, soft texture.
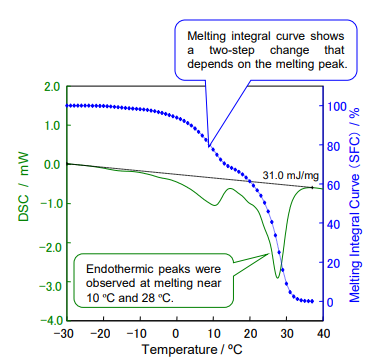
Figure 1: Example of DSC thermogram for creamy chocolate
DSC also allows you to test the effects of low temperature storage. While your sample is within the instrument, you can reduce the temperature to sub-zero levels, which will have an influence on the crystallization of the chocolate which influences its texture. If you run a DSC test before cooling and another one after, you can compare the results to check whether your product still has the required properties after cold storage and transportation. Typically, exposure to very cold temperatures will lower the melting point of the chocolate.
Figure 2 below shows the effect on cacao butter of storage temperature as well as storage time on its melting behaviour. There are six known types of crystal polymorphs (Type I to VI) of cocoa butter. The higher the number, the more thermally stable the structure is. By analysing the crystal polymorphs of cocoa butter, product characteristics such as heat resistance, storage stability, and texture can be determined, which makes it possible to control the how your chocolate will feel when you eat it. This also shows the importance of storage temperature on your chocolate properties such as how creamy it will be. In other words, your chocolate’s creaminess, snap, and melt-in-the-mouth moment all depend on how well its crystals are behaving behind the scenes.
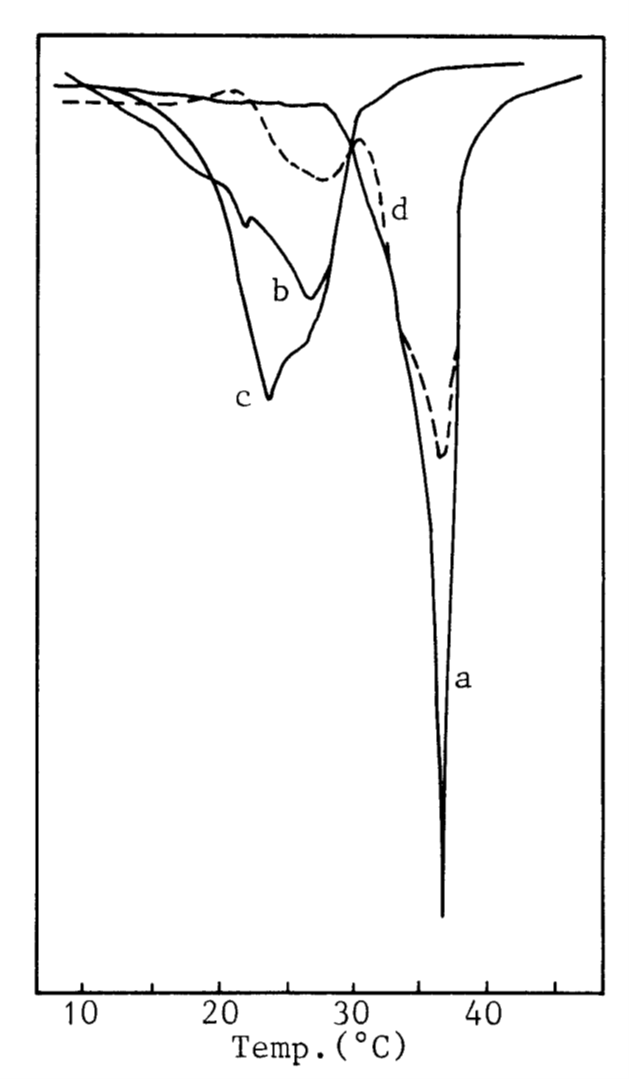
Figure 2: Cocoa butter untreated (a), kept at 10C for 1h (b), kept at 10C for 210h (c) and kept at 30C for 984h (d) DSC melting profiles.
Fat behaviour isn’t the only factor shaping chocolate’s texture, formulation matters, too. To show how different types of chocolate respond to temperature, samples were tested both as received and after being melted and cooled under controlled conditions.
Figure 3 shows the melting behaviour of creamy, milk and high-cacao chocolate. The creamy chocolate displays endothermic peaks at around 10ºC and 28ºC, meaning most of its fat melts at room temperature and giving it its soft, creamy texture.
Milk and high-cacao chocolates, by contrast, show melting peaks at around 33ºC and 34ºC. Most of their fat melts above room temperature, which is why they are firm at first bite and then gradually soften.
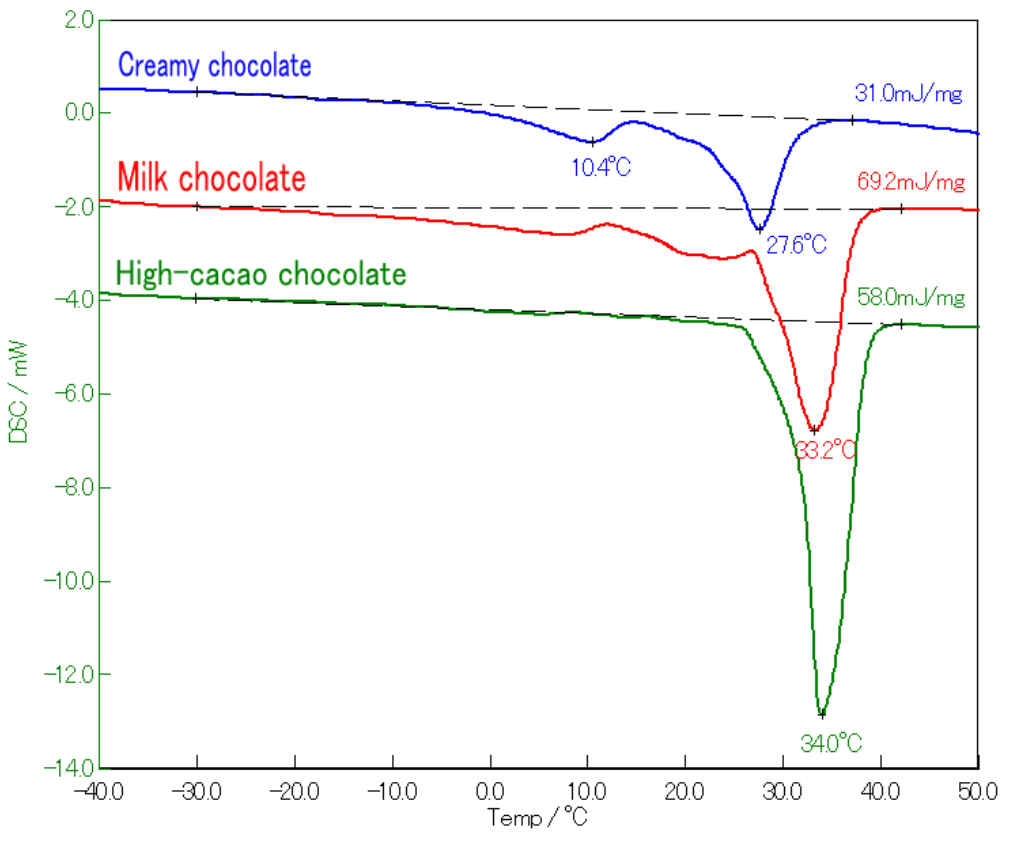
Figure 3: 1st heat DSC curves of creamy (blue), milk (red), and high-cacao (green) chocolate.
These three types of chocolate were then cooled to -50ºC at 10ºC/min to re-crystallize them. Figure 4 shows the DSC curves of 2nd heating. By comparing the 1st and 2nd heating curves, it can be observed that the melting temperature of all samples was lowered and that a portion of the chocolate is still melting at room temperature. This indicates that melting properties of all these chocolates were highly influenced by the cooling process.
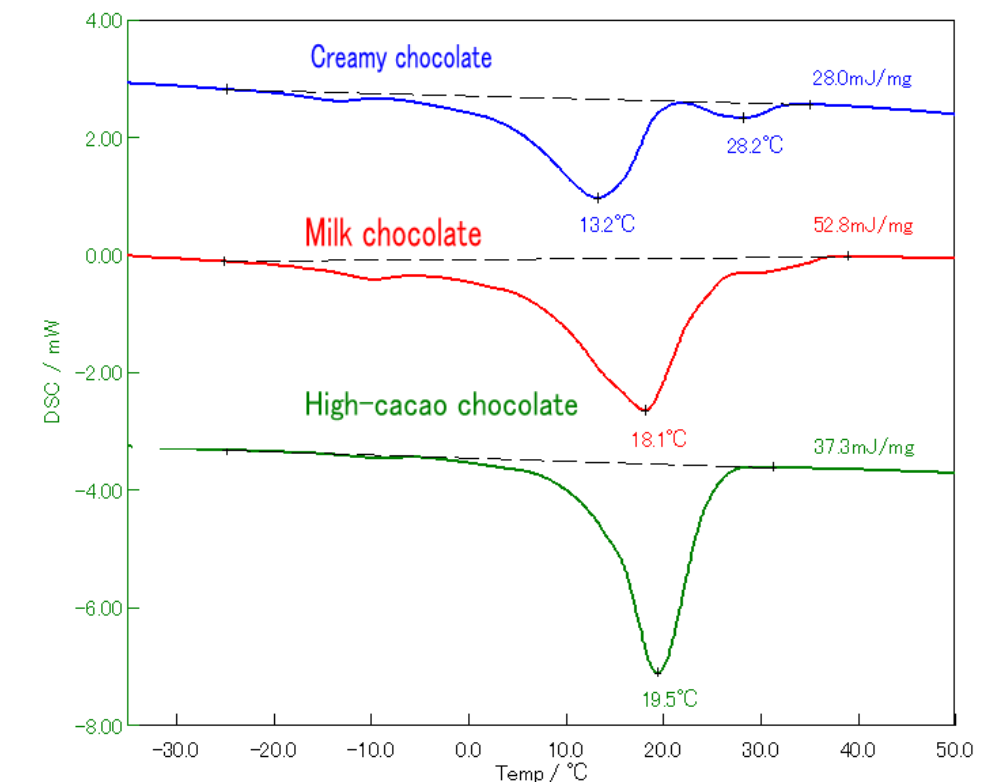
Figure 4: 2nd heat DSC curves of creamy (blue), milk (red), and high-cacao (green) chocolate.
As showed earlier in Figure 1, a DSC can also measure the solid fat content (SFC) which is a metric of the fat and oil content in food. This is generally measured using pulsed NMR, but a simple alternative technique can be used by obtaining an integral curve from the DSC melting peak(s). The quantification of SFC is an important property as it influences how soft or hard the chocolate is. Manufacturers can play with this property to meet their customer’s needs. Figure 5 shows the SFC profiles for the three chocolate types. The creamy and milk chocolates begin to lose solid fat below 0ºC, while the high-cacao chocolate only starts melting around room temperature.
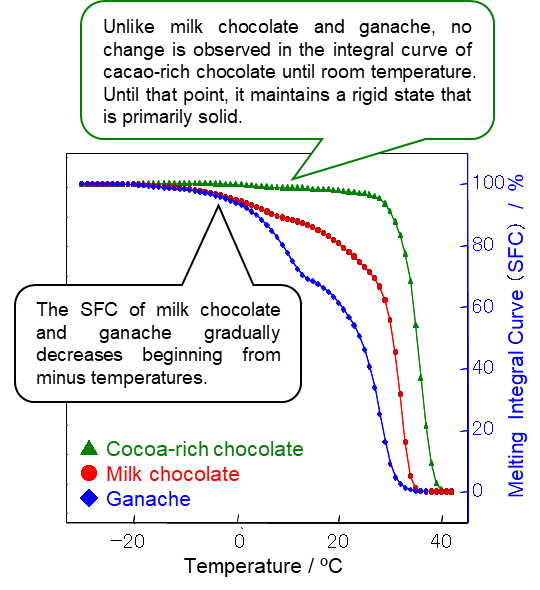
Figure 5: SFC results for creamy (blue), milk (red), and high-cacao (green) chocolate
Another way to understand the melting behaviour of chocolate is to use real time image capture in combination with a DSC. Figures 6 and 7 show DSC results for white and dark chocolate. In this heat–cool method, real-time images help illustrate the melting and crystallisation process. For example, while the white chocolate shows a melting peak at 11.6ºC, the images reveal that its appearance does not change until it fully melts at 32.4ºC.
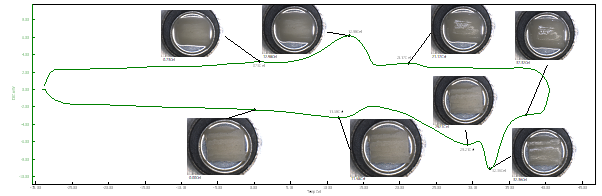
Figure 6: Real-time image capture of DSC heat-cool measurement of white chocolate
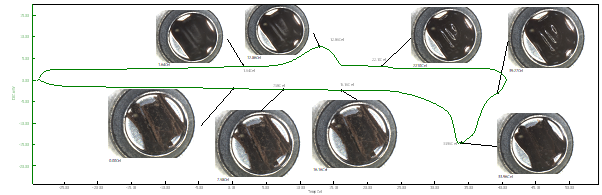
Figure 7: Real-time image capture the DSC heat-cool measurement of dark chocolate
Temperature has a major influence on chocolate properties, so understanding its effect is essential for achieving the right texture. A DSC lets manufacturers see how chocolate melts, calculate solid fat content at different temperatures, and, with real-time image capture, visually confirm what is happening during each stage of heating and cooling. This gives a clearer view of melting and crystallisation behaviour than the thermogram alone and helps QA teams spot inconsistencies faster and make more confident decisions.
The NEXTA DSC range of thermal analyzers is designed for accuracy, sensitivity and ease of use. A unique furnace design with low heat capacity and three layer insulation gives you excellent baseline flatness that is able to detect the smallest changes in the thermal properties of your samples.
Pair Real View™ with the autosampler for high-volume testing and easy report creation, then add options as you need them.
Discover our DSC range here.
To find out more about how our range of thermal analyzers can help maintain quality in chocolate production, get in touch.