Photosensitive resin, also called photoresist, is a material whose properties change when exposed to light (ultraviolet rays). Photoresist has features such as high resolution, microfabrication, and the ability to form etching-resistant thin-film in a short period of time.
It’s used in a wide number of areas including printed circuit board wiring, electronic parts manufacturing and print plate-making. In other examples, ultraviolet adhesives with short-time curing type are used in wider number of fields such as general electronics and optical electronics as well as medical fields, glass arts and architecture.
When new photosensitive resins are developed, curing reaction heat is one of the characteristics that must be evaluated. It’s known that conditions during light curing, including exposure wavelength, irradiation intensity and reaction temperature, change the formation of etching-resistant thin-film. So it’s necessary to consider various curing conditions when attempting to form the optimal etch-resistant thin-film.
Curing reaction heat when the UV (ultraviolet) is irradiated can be measured in real-time by using differential scannning calorimeter (DSC) and an UV irradiation unit with photochemical reaction differential calorimeter (PDC).
How does photochemical reaction differential calorimeter (PDC) work?
PDC is used in combination with a DSC, and irradiates the sample with ultraviolet light from a UV light source through a light guide. By mounting the light irradiation attachment, the light guide is inserted from above the jacket, and the sample and reference can be irradiated with light through the quartz lid.
By using either of the cooling units, electrical cooling unit or auto-liquid nitrogen cooling unit, the temperature rise caused by the heat of the irradiated light is prevented and the temperature can be measured in an isothermal condition.
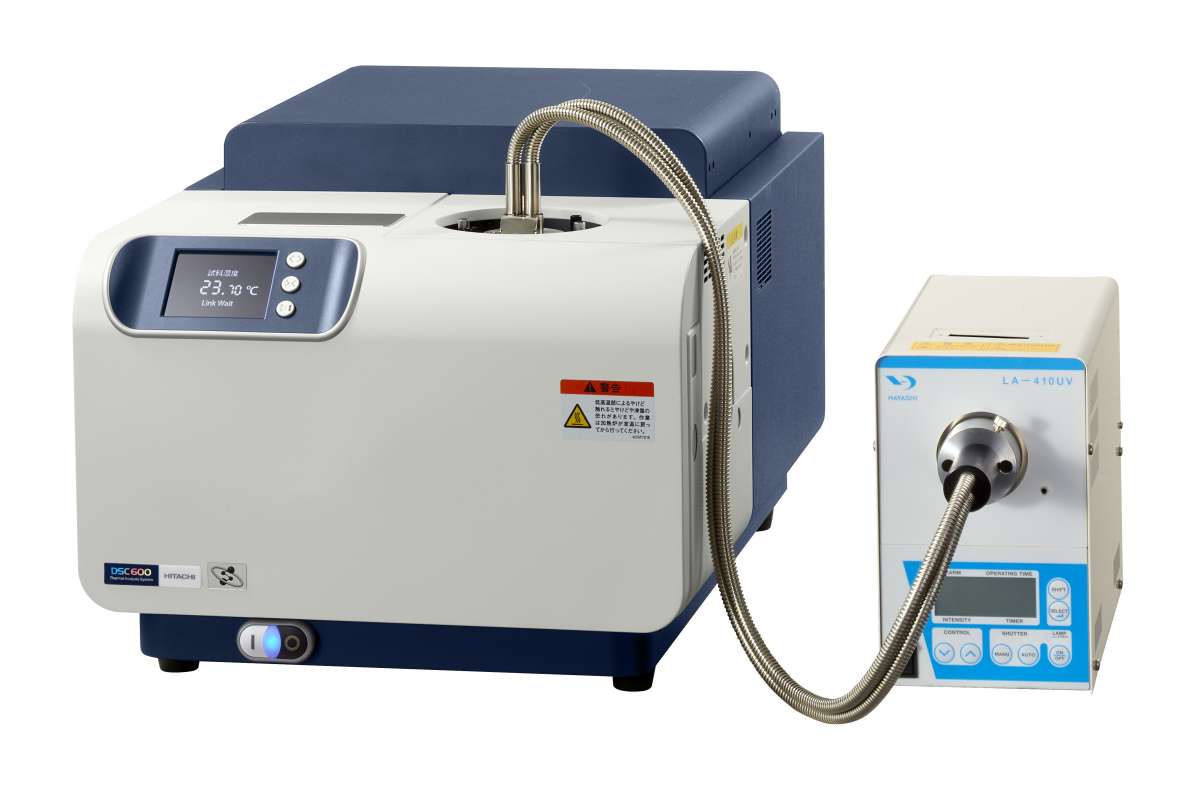
Image 1: Photochemical Reaction Differential Calorimeter
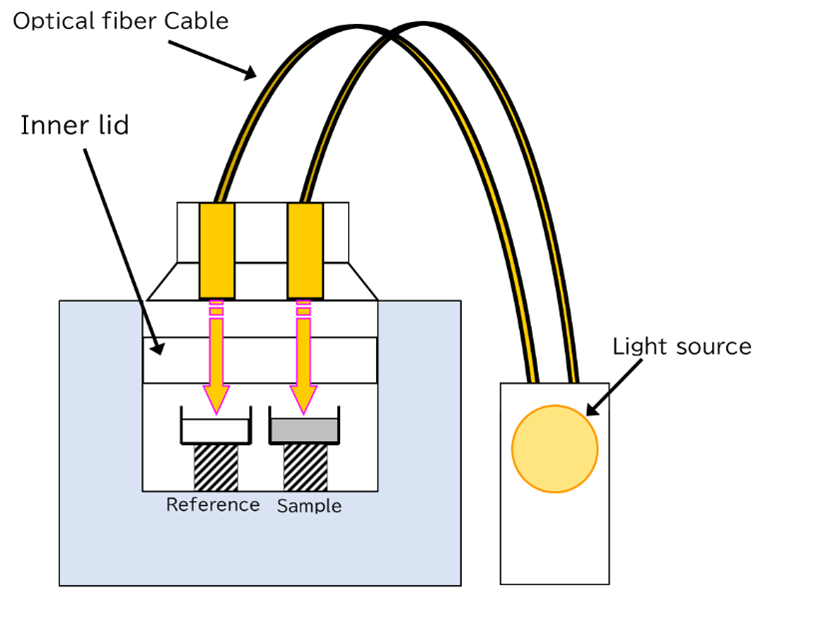
Image 2: PDC Conceptual diagram
What phenomena does PDC give information about?
PDC can measure the amount of heat and curing speed in the curing reaction when changing the exposure wavelength, irradiation intensity or irradiation time For example, Figure1 shows irradiation measurement results in case of irradiation intensity 1,2,10,20,100 and 500 mW/cm2. As the irradiation intensity increases, the amount of exothermic heat tends to get more intense and curing reaction amount is increased. A fast curing reaction is measured by how fast the exothermic peak is reached.
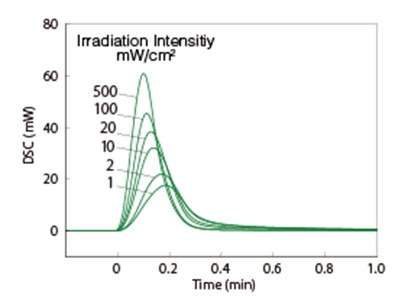
Figure 1: Irradiation intensity difference
What are the advantages of using PDC?
・ High-output UV light source
・ Irradiation intensity up to 500 mW/cm2
・ Irradiation intensity is easily adjustable
・ Same instrument cover as for normal analysis
・ Similar operating process and reproducibility improvement
・ Wavelength-selective filter
・ 254, 313, 365, 405, and 436 nm
・ Easily changeable filters
・ General purpose DSC possible – easily detacheable when light irradiation isn’t performed.
Measurement examples with PDC
The measurement results with PDC for 1mg of dry film photoresist, which is used in the etching of printed circuit boards, are shown below. To investigate the differences in calorific value due to curing, measurements were performed under different irradiating light wavelength, irradiation intensity and curing reaction temperature conditions. The light source was an Hg/Xe lamp and the irradiating light wavelength was selected from wavelength filters.
Figure 2 shows the DSC measurement results for the different irradiation intensities. The irradiation wavelength was 365nm. Irradiation was started one minute after the measurement started and four irradiation intensities were used: 1, 5, 10 and 50mW/cm2. Immediately after irradiation, exothermic heat was generated by the light-curing reaction and the reaction ended after about six minutes. In general, the higher the irradiation intensity, the higher the number of reaction calories. The same applies when the irradiation intensity is low, the curing reaction doesn’t completely progress and the degree of polymerization is reduced.
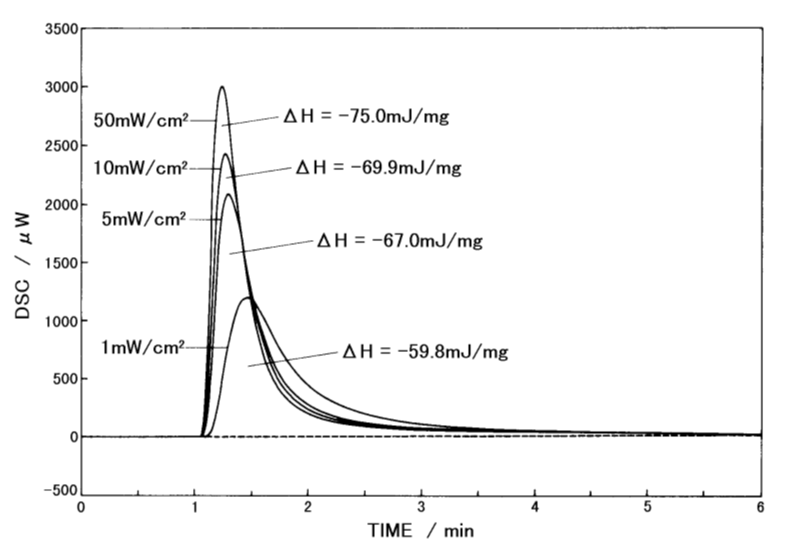
Figure2: DSC curves for dry film at different irradiating intensities Irradiating wavelength: 356nmMeasurement temperature: 25°C
The integral curves shown in Figure 3 were created by peak area integration software for the measurement results in Figure 2. The total calorific value was set as 100% on the vertical axis and the peak percentage up to each time period is shown. The results show that higher the irradiation intensity, the greater the initial rise of the integral curve and the faster the curing reaction rate.
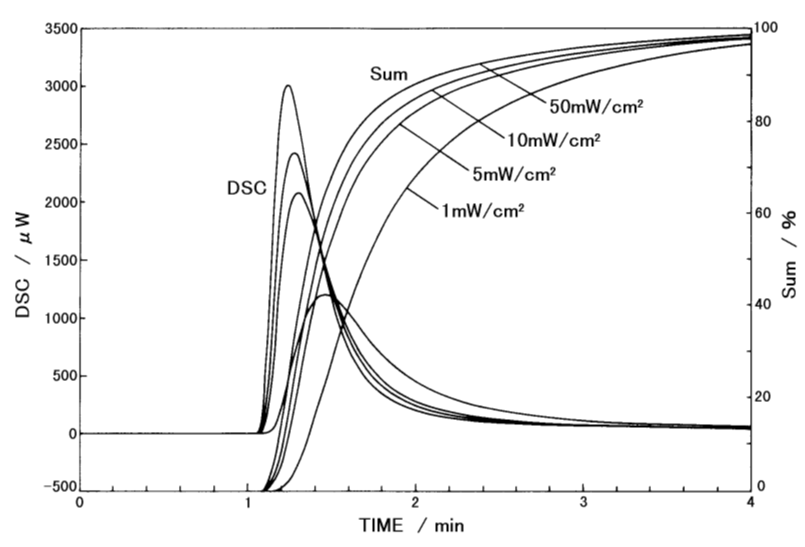
Figure 3: Integral curves of calorific valuesIrradiating wavelength: 356nmMeasurement temperature: 25°C
Figure 4 shows the DSC measurement results for the different irradiation wavelengths. The irradiating intensity was 5mW/cm2 and the irradiation wavelengths were selected from five interference filters. According to these results, when the irradiation wavelength was 365 or 405 nm, the peak was particularly large for this measurement sample, which indicates that wavelength has a large effect on the reaction rate. This example shows that careful attention must be paid to the choice of irradiating wavelength when curing by irradition is measured.
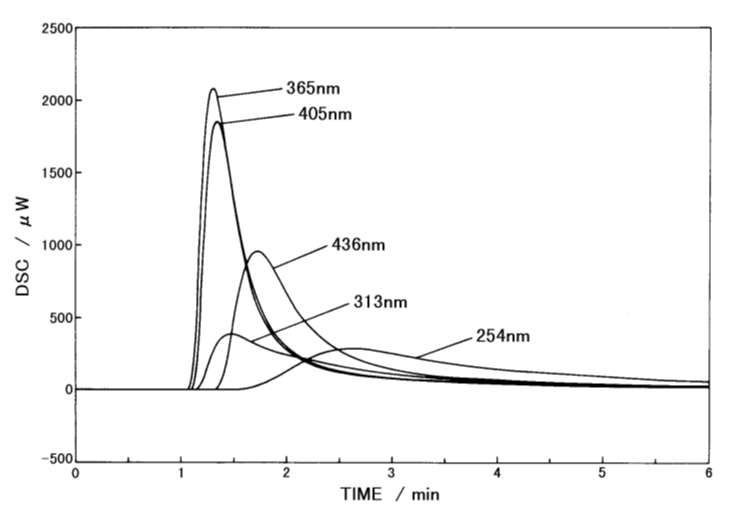
Figure4: DSC curves for dry film at different irradiating wavelengthsIrradiating intensity : 5mW/cm2Measurement temperature : 25°C
Figure 5 shows DSC measurement results performed at different temperatures. The results indicate that the higher measurement temperature increases the calorific values and makes polymerization reactions faster.
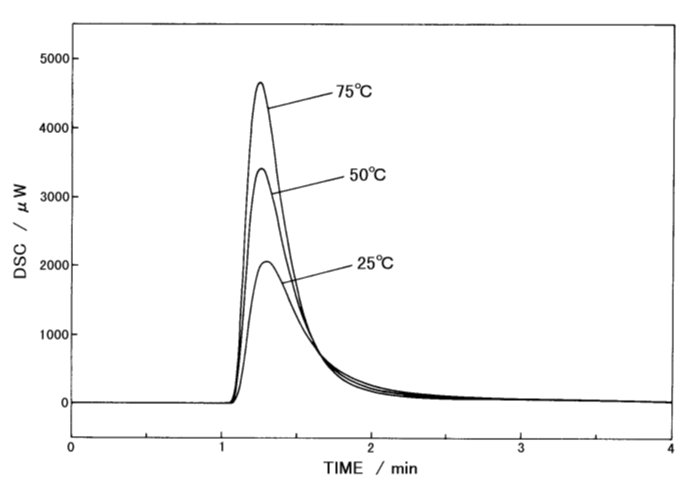
Figure5: DSC curves for dry film at 4 different measurement temperatures Irradiating intensity : 5mW/cm2Irradiating wavelength : 356nm
Specifications
Model | PDC-8 |
Temperature range | Ambient to 150℃ |
Atmosphere | Air, Inert gas |
Wavelength range | 240 to 550nm |
Wavelength selection | 254,313,365,405 and 436nm |
Irradiation intensity | Max. 500mW/cm2 |
Irradiation intensity adjustment | 0 to 100% |
Hitachi’s range of DSC analyzers for visibly better thermal analysis
Our NEXTA DSC instruments offer world-class sensitivity and baseline reproducibility, delivering more accurate testing and the ability to evaluate even the smallest thermal events.
Our innovative Real View® camera system provides real-time observation during measurement which allows to colour analysis, dimension change measurement as well as understanding unexpected results. Having access to images of your sample during the measurement also helps to share results with your colleagues and customers who might not know this technique.
The DSC200 offers leading technology for routine applications without limitations and ideal for a wide variety of applications. The DSC600 is purpose designed to meet the most advanced materials development and failure analysis thanks to its sensitivity and resolution, especially within applied research.
Discover more about our range of DSC thermal analyzers or talk to our expert to see how you could benefit from using UV-DSC.
Find out more about DSC analyzers Get in touch with an expert