To understand cement properties and their long-term effects, measurements such as level of hydration, loss on ignition (LOI), composition of the material (e.g. calcium carbonate in interground limestone) and the evaluation of kinetic parameters of thermal decomposition are important factors. EDXRF (energy dispersive X-ray fluorescence) is a well-established and a powerful analysis technique for raw materials and finished goods as a means of quality control testing in the cement industry. WD-XRF (wavelength dispersive X-ray fluorescence) and XRD (X-ray diffraction) are also used, but as with all analytical techniques, they have some limitations1. Thermal analysis is used as a complimentary technique to XRF and XRD in order to understand all of the parameters mentioned above.

Thermal analysis is a group of techniques in which a property of the sample is monitored against time or temperature while the temperature of the sample, in a specified atmosphere, is programmed. By studying the effect of temperature and/or time on cement, it’s possible to measure the key parameters.
These instruments will normally be made of a detection unit (e.g. furnace with thermocouples and/or balance), a temperature control unit to control the furnace temperature and a data recording unit which records the signals of the sensor and the sample temperature to analyze them.
While thermal analysis includes a wide variety of techniques, the main thermal analysis techniques are Differential Scanning Calorimetry (DSC), Thermogravimetry (TG) or Simultaneous Thermogravimetry Analysis (STA), Thermomechanical Analysis (TMA) and Dynamic Mechanical Analysis (DMA). The main techniques used for cement analysis are DSC and TG.
DSC is a technique in which the temperature of the sample unit, made up of a sample and reference material, is varied in a specified program. The temperature difference between the sample and the reference material is measured as a function of temperature. Figure 1 shows a simplified representation of a generic heat flux DSC furnace.
By measuring the heat flow, this technique allows the measurement of exothermic and endothermic reactions, such has evaporation which can be used to quantify materials like dihydrate and hemihydrate gypsum present in cement2.
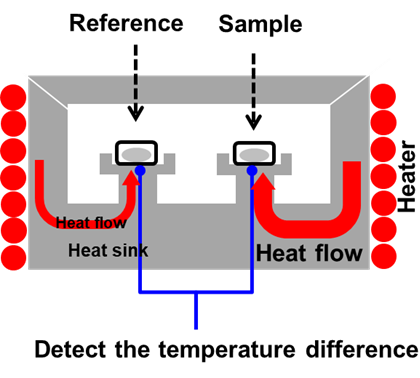
Figure 1: DSC Furnace
TG is a technique in which the mass of the sample is monitored against time or temperature while the temperature of the sample, in a specified atmosphere, is programmed. It’s used to detect evaporation, decomposition, oxidation and other effects of temperature change that cause changes in mass.
STA (TG/DTA or TG/DSC) is like TG, but it also includes differential thermal analysis within a single apparatus. This is the most common technique used for cement analysis since it can provide TG and DTA/DSC results, as well as being able to go to high temperature (>1000 ̊C). Figure 2 shows an example of a simplified representation of a STA horizontal double beam design.
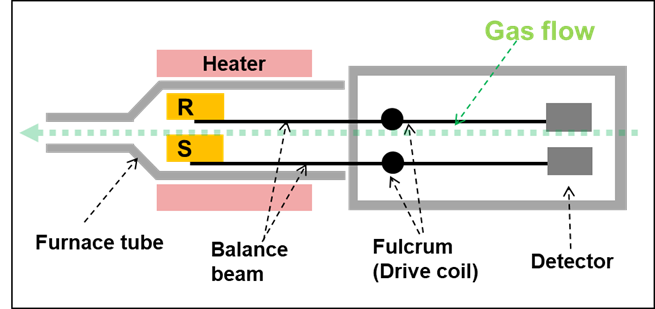
Figure 2: STA Furnace R = Reference and S = Sample
TG or STA can also be linked to an external detector such as an FTIR, MS or GCMS which will allow the identification of the evolved gas happening during the experiment.
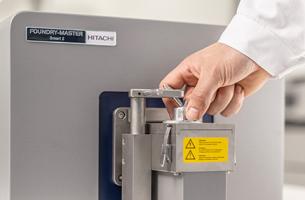
Step 1: Installation and calibration
DSCs and STAs are extremely easy to use and don’t require much sample preparation. Once installed in a vibration free area, only purge gas (Nitrogen and/or dry air) and power are required to operate the system.
The calibration of DSCs and STAs needs to be checked on a regular basis to make sure they are within specifications. If a recalibration is required, it can usually be performed by the users.
Step 2: Sample preparation and analysis
The sample could be dry powder or a paste of cured cement, with a known accurate weight. It’s then placed in a crucible usually made of aluminum or ceramic before being placed in the sample holder. The crucible is either open, semi-hermitic or hermetic depending on the method used. Sample weight can vary between 10 and 100mg depending on the type of analysis and information required. A reference is also added, which consists of an empty crucible of the same type as the one used for the sample.
Once the sample is in position, the temperature program starts to perform the analysis. The temperature program is either isotherm or increased at a constant rate depending on the method required to be performed.

Figure 3: Sample positioning in DSC furnace
Depending on the purchased system, the samples can be inserted manually or with the help of an autosampler (can hold up to 50 samples).
Step 3: Results interpretation
To help understand how to interpret the results, TG, DTA and DSC results will be used.
Figures 4 and 5 show the TG and DTA results obtained on different types of cement. The results were obtained by following ASTM C1872 – 18.
Figure 4 shows the TG (top three curves) and DTG (derivative thermogravimetry) (bottom three curves) results for NBS: SRM633 dried 1 and hydrated 3 as well as JCM-211M 2. In this case, the x-axis represents the sample temperature while the y-axis (left) is percentage weight (%wt) loss and y-axis (right) is the derivative of the percentage weight loss.
Each weight loss is due to different components within the cement materials and can be found in the table 1. A complete list of weight loss can be found in a paper written by Collier1.
The difference between samples is observed in the weight loss curves of 1 and 2. This shows the difference of component ratio. The increase of free water the amount of OH groups can also be observed and quantified in the weight loss curves of 1 and 3.
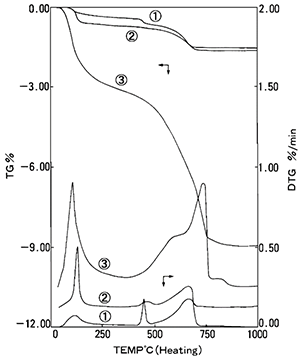
Figure 4: TG (%) and DTG results for 1 NBS (SRM633), 2 JCM-211M, 3 NBS Hydrated
Table 1: Weight loss during analysis of cement samples
| Temperature | Weight Loss |
| ~100 ̊C | Dehydration – free water |
| 120 - 100 ̊C | Dehydration – gypsum crystal water |
| 400 - 500 ̊C | Dehydration – calcium hydroxide |
| 500 - 750 ̊C | Dehydration – OH loss |
Figure 5 shows the DTA curves for each cement sample. In each sample, an endothermic peak appears, and shows that a relationship exists between the weight loss and the size of the peak. Since it’s possible to calibrate the DTA signal to quantify heat flow on some instruments, it’s also possible to use these results to quantify components.
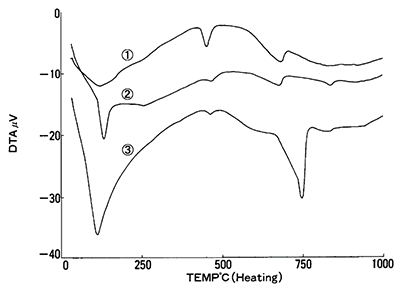
Figure 5: DTA results for 1 NBS (SRM633), 2 JCM-211M, 3 NBS Hydrated
DSC is also an important technique when it comes to testing specific materials which could affect cement properties. Gypsum is one of the important components of Portland cement where it’s important to understand its properties before and after mixing. The energy released during the milling process could lead to partial dehydration of the gypsum to hemihydrate, which could affect the rate of settling as well as the long-term properties of the cement3. Since neither XRD or XRF are able to provide this information, DSC could play a vital role in the characterization of cement.
Figure 6 shows the DSC result for gypsum. The two peaks (157 ̊C and 202 ̊C) are showing the dehydration process of gypsum showed in Figure 8.
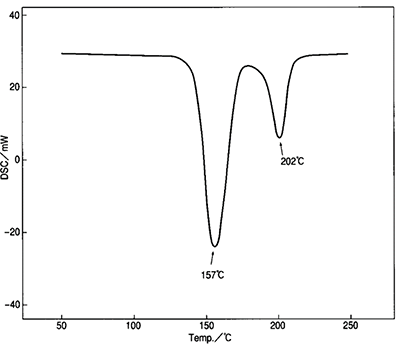
Figure 6: DSC results for dehydrated gypsum

Figure 7: Drying equation of gypsum
By integrating both peaks, we can see if the stoichiometry of the equation is what is expected and if the milling has affected the final product.
Thermal analysis, and especially DSC and TG/STA, are essential complimentary techniques to EDXRF, WDXRF and XRD for cement analysis. They bring valuable information such as hydration, loss on ignition (LOI), composition of the material and the evaluation of kinetic parameters of thermal decomposition of cement which other techniques can’t. They’re also easy to use and with the help of an autosampler, the complete analysis from sample introduction to exporting results can be automated.
Our range of thermal analyzers have an unsurpassed level of baseline stability, world-class sensitivity and advanced capabilities to give you the complete picture of thermal behaviour of cement. They’re optimized to detect minute changes ultimately to give you visibly better thermal analysis.
Contact us to arrange your demo today or to request a quote.
Contact Us
You might also be interested in:
References: