When we take a measurement with our spectroscopy instrument, we want to trust the result. Whether we are measuring composition or thickness, and whether our method is XRF, OES or LIBS, we want the result to be as accurate as possible.
The first step in trusting the results of our measurements is in understanding what we mean when we talk about accuracy.
In spectroscopy, accuracy is a measure of how near our measured value is to the expected value. (We hope that the expected value is the real value, but as we cannot know the real value, we use the term expected value.)
The level of accuracy is dependent upon two factors:
Precision. The repeatability of measured values. If I measure the same sample several times, at the same point with the same equipment running the same procedure, how repeatable are my results?
Trueness. If I take several measurements, does the mean value match the expected value? This is also called the ‘accuracy of the mean’.
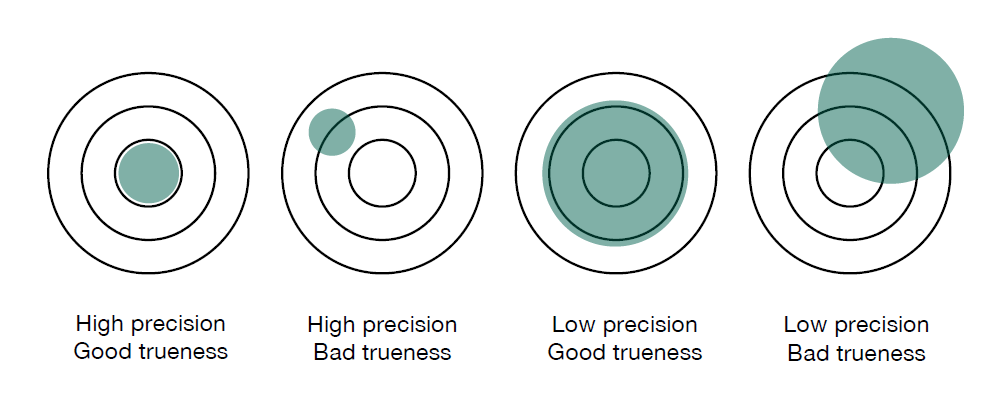
The following diagram illustrates how precision and trueness work together to affect accuracy.
Institut für Informatik - Humboldt-Universität zu Berlin
https://www2.informatik.hu-berlin.de/~hochmuth/praez.shtml
You can see that it’s possible to have good precision, yet poor trueness. And it’s possible to have high trueness (accuracy of the mean) and poor precision. For a truly accurate result, we want both high precision and trueness.
We should begin by discussing the errors we’d like to eliminate, before addressing the errors we can only hope to reduce.
Our first task is to check for and eliminate gross errors from our measurements. If we look at the above diagram, a gross error would result in a measurement lying completely outside the green area and would probably be picked up as an anomaly. Process errors, such as sample contamination during preparation, can cause gross errors. As can defective samples, such as cavities in the measurement area, or running the incorrect measurement routine. Gross errors can be avoided through training and using the correct procedure.
There are two types of errors that we have to assume will exist within our measurement system:
Systematic errors usually relate to trueness and give a consistent offset between the mean of the measured sample and the expected result. These are due to faults of the equipment, such as a lack of maintenance, worn parts or poor calibration. As the offset is consistent for every measurement within a defined area of interest, it’s possible to measure the offset and then incorporate a correction factor into your sample measurements. Systematic errors can be reduced by regular calibration and maintenance.
Random errors relate to precision. The greater the random variation, the less precise the measurement and the larger the error margin. Unlike systematic errors, they are unpredictable and are estimated with statistical methods. These measurement fluctuations can be due to inhomogeneity of the sample, tiny changes in the measurement environment and the measurement uncertainty of the reference samples used for calibration. The goal is to increase precision as much as possible with good procedures and well-maintained equipment.
In reality, the only way you can completely trust the result is if you know the error margin of your readings. In every measurement, there is always a margin for error arising from the limitations of the measurement system and random fluctuations within it. To get the most accurate readings possible, we should eliminate the gross errors, reduce the systematic and random errors, then accept and calculate the remaining error margin within an agreed confidence level.
In essence the statement: Chromium composition is 20% + / - 0.2% at a 95% confidence level is a trustworthy result. Whereas the statement: Chromium composition is 20% is not complete and cannot be reliable.
Want to know more?
Systematic errors (the offset of the mean) can be determined by a straightforward calculation. Random errors follow a statistical model. We’ll show you how to calculate both of these types of errors in our guide ‘The Search for True Values’. Download your copy here or click on the button below.