One of the most comprehensive methods of calculating measurement uncertainty is the one recommended by the regulatory bodies ISO (International Organisation for Standardisation) and BIPM (Bureau International des Poids et Mesures). The method is known as GUM, which stands for Guide to the Expression of Uncertainty in Measurement.
The method is used when you have a reference sample of composition similar to what you expect in your unknown (production) sample, and that reference sample has a certified compositional value. The reason that this method is so comprehensive is that it takes into consideration all error margins of all the measurements that have been taken to get to an accurate result. This means it includes the error of the certified value of the reference sample, the error in your own measurements of the reference sample, and the error of your measurements of the unknown sample.
The expression for calculating a confidence interval according to GUM is:
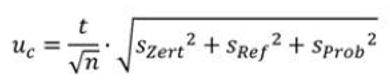
Let’s discuss each of the terms in this expression before going through an example.
t is the value of the Student t-distribution function. This is essentially a multiplication factor used in any statistical system where the number of measurements (values) is relatively small. The value of t depends on two factors: the number of measurements and the desired confidence interval. You can get the value for t from published tables.
n is the number of measurements you’ve taken of your reference sample and unknown sample.
szert is the standard deviation of the certified value of the reference sample. This is taken from the certificate supplied with the reference.
sref is the standard deviation of our measurements of the reference sample
sprob is the standard deviation of our measurements of the unknown sample
When calculating the measurement uncertainty, the first thing is to choose a confidence level. We’ll use 95% as that is very common in spectroscopy.
We’ll use the following values for the level of chromium in a sample:
| Cr | |
| Average value of reference sample from certificate | 18.46% |
| Standard deviation of reference sample from certificate szert | 0.05% |
| Average value of reference sample from analysis (10 readings) | 18.54% |
| Standard deviation of reference sample from analysis sref | 0.1% |
| Average value of unknown sample from analysis (10 readings) | 18.82% |
| Standard deviation of unknown sample from analysis sprob | 0.15% |
t: 2.262 for a confidence level of 95% and sample size of 10
n: 10 (10 measurements of each sample)
We plug these numbers into the expression above, which gives us:
Uc = 0.134%.
Therefore, we can say that we are 95% sure that our unknown sample includes Cr at a composition of 18.82% +/- 0.13% according to GUM guidelines.
However, we have only considered the random fluctuations around the mean, we have not considered the possible systematic deviation of the mean. For a complete value of measurement uncertainty we will need to take this accuracy of the mean (or trueness) into account.
We cover everything you need to know to work out your own error margins in your spectroscopy measurements in our comprehensive guide. The Search for True Values. This includes why errors occur and what you need to do if you don't have a reference sample. Download our copy of the guide here.