To evaluate the error margin in a measurement, you can use basic statistical methods to calculate standard deviation as we’ve already discussed here. However, even the estimated standard deviation for a sample of the whole population still assumes a relatively large amount of measurements. In spectroscopy, we usually take a handful of measurements of a sample, perhaps 5 to 10. At this sampling level, using the basic expressions for standard deviation of a normal distribution does not give us reliable values for the measurement error. Thankfully, work done in the early 20th century on beer production gives us a solution.
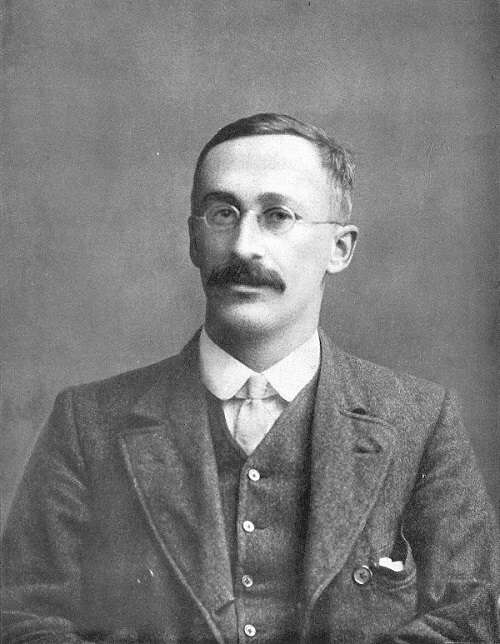
William Sealy Gosset, Wikipedia.org
William Sealy Gosset was a statistician who worked as Head Brewer at the Guinness Brewery in Dublin. He was concerned with getting the best yield from varieties of barley – a key ingredient in beer. He encountered the small sample size problem in his work when he had to draw meaningful statistical conclusions from as little as three grains of barley.
In his paper, The Probable Error of a Mean , published in 1908, he describes the problem thus:
“as we decrease the number of experiments, the value of the standard deviation found from the sample of experiments becomes itself subject to an increasing error, until judgements reached in this way may become altogether misleading.”
Gosset developed what came to be known as the Student t-distribution function (named because he published the paper under the pseudonym ‘Student’) and published tables of values that can be used for very small sample sizes. The distribution is wider and shorter than the normal distribution and allows for more outlying measurements. As the number of measurements increases, the distribution moves towards a classic normal curve.
The expression for the confidence interval given by the t-distribution function is:
uc= x̅ +/- Tx
Where:
x̅: average of the measured values
TX: value of the t-distribution function. This is calculated from the following formula:
Tx= (t (f,P) x s / N1/2
Where:
t: value taken from published tables which depends on f (number of samples measured - 1) and P (the desired confidence level).
s: standard deviation of the measurement series
N: number of measurements taken
Let’s take some real-world composition results for chromium in a component and walk through the process of using the Student t-distribution function to calculate a confidence interval.
Average of 10 readings: 18.54 %
Standard deviation: 0.1%
We’ll choose a confidence level of 95%, therefore the numbers were have to work with are:
N: 10 (10 readings)
s: 0.1% (standard deviation taken from table above)
t: 2.262 (taken from published tables for confidence interval of 95.9 and sample size of 10, f = n-1)
Therefore:
Tx = (2·262 × 0·1%) / 3·162 = 0·072 %
Which we can use as our confidence interval:
uc = x + /- Tx
x: 18.54 (mean value of measured results, taken from table above)
uc (95.9) = 18.54 % +/- 0.07 %
Which means that we’re about 95% confident that the true value for chromium lies between 18.47% and 18.61%.
Interestingly, the t-distribution function has given us a confidence interval that is less than the standard deviation, which means our spectroscopy measurements are actually more precise than the standard statistical method may suggest.
Of course, to use this method you must be taking several readings of a single sample in your analyser.
We discuss how to accurately calculate the confidence interval of your spectroscopy measurements in our Guide: The Search for True Values. In this we work through examples for actual spectroscopy measurements and explain what to do when you don’t have all the information you need to estimate the true error of your measurements. Download your copy here.