Although thermal analysis techniques like DSC, STA, DMA and TMA have been around for a long time, it’s always been a challenge to know what is really happening to our samples during an experiment. From colour to dimension changes, being able to see how the sample behaves when heated up or cooled down can add important information to the thermal analysis story. Visible images can also be used as a valuable troubleshooting tool to explain an unusual behaviour during an experiment.
This presentation will go through the advantages of being able to see the samples while using thermal analysis techniques (DSC, STA, DMA and TMA). Real examples will be used to show the power of the techniques and it will also cover the extra information which can be extracted from a visible image (e.g. RGB values).
The webinar is being presented by our thermal analysis specialist, Olivier Savard. We expect the webinar to last around 20 minutes and there will be plenty of opportunity to answer your questions in a Q & A session at the end. If you have any questions now, please submit your question when you fill in the registration form below. You will be able to submit questions during the webinar too.
To secure your place, please click on the link below
Register Now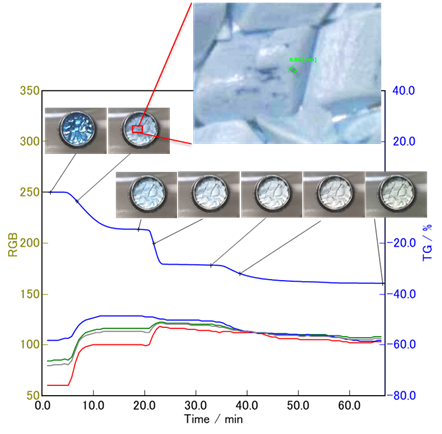
Real View® Example with RGB Values