Simultaneous thermogravimetric analyzers (STA) have DSC (differential scanning calorimetry) and TGA (thermogravimetric analysis) capabilities within a single instrument. In this post we look at why most people decide to opt for a STA instrument over standalone TGA – and why having both techniques within a single instrument gives you benefits over standard DSC too.
Let’s start by looking at TGA and what information you get from this thermal analysis technique. In basic terms, thermogravimetric analysis is a technique in which the mass of the sample is monitored against time or temperature, while the temperature of the sample is controlled.
The most common use of standalone TGA is compositional analysis. A simple case of this is noting at
which temperature a metallic material with polymer coating begins to oxidize as shown here:

This graph shows a typical TGA output in an oxidative environment temperature on the x axis and weight on the y axis. The material matrix is heated and, as you would expect, the trace is pretty flat until organic material starts to burn off, where we see a sharp reduction in weight. Then, once the metallic component begins to oxidize, the weight gradually increases before plateauing (when there’s no more available material in contact with the oxygen).
If we look at a more complex system than simple metal oxidation, like a sample of tire rubber, we’ll see that TGA gives us more information:

The diagram is fairly self-explanatory, but we can see that there are several marked changes in weight that are explained by what we expect to happen. And that is one of the problems with the technique – we say that a drop in weight is due to loss of oil, but we don’t test for the oil, it’s an assumption based on previous experience and general knowledge. But modern regulations and perhaps the reputation of our products require a bit more than a guess on what we expect to happen. To find out if it is actually oil or what type of oil an analysis of the evolved gasses would need to be performed with an instrument such as FTIR or a mass spectrometer. We can connect our NEXTA STA to one of these systems to undertake this type of analysis seamlessly.
The second limitation of TGA alone is that is only tells us when there’s a change in weight (or, more accurately, mass). Now, clearly this is the technique and this information is useful to give part of the picture. But if you are trying to understand detailed changes within a material over a temperature range to predict future performance, for example, an instrument that only reports change in mass is not going to give you the complete picture.
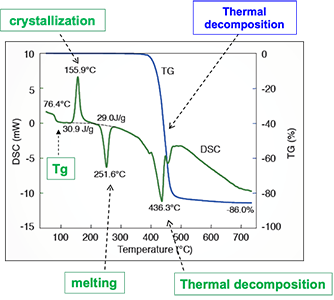
Many people choose STA over TGA, which gives some DSC capability in addition to having all TGA capabilities within a single instrument. Let’s look at the melting behavior of PET to illustrate this:

The blue line is our TGA output and the green line the DSC output. With DSC, which measures the change in temperature of a sample against a control sample, peaks relate to exothermic reactions, and troughs to endothermic ones. What is most striking about the above diagram is how much is going on in the flat portion of the TGA curve; we’ve got a glass transition, cold crystallization and melting going on before the thermal decomposition that both techniques indicate.
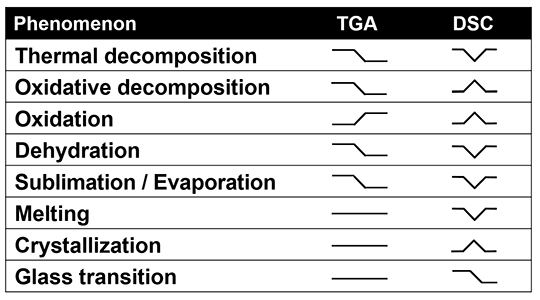
In fact, we can use the outputs from DSC and TGA in tandem to explain what type of thermal process is going on within a sample. So, a thermal decomposition will show as a drop in weight and an endothermic peak. Oxidation is seen as a gain in weight and an increase in energy. More examples are illustrated in the following table:

It’s worth noting that in practice, you can usually tell whether dehydration or evaporation is occurring by the very specific shape of the DSC curve. This, together with the quantitative results obtained from the TGA part of the STA, means you can build up a very accurate picture of what’s going on. The DSC will help to understand what thermal process is happening during analysis.
Usually, the peak temperature of a typical DSC instrument is around 700ºC. Compare this to the temperature range of a STA instrument, which rises from ambient to over 1,000ºC. (The Hitachi High-Tech STA 300 actually reaches 1,500ºC.) This means you can use the DSC technique over a higher temperature range. A great example of this is iron. The following graph shows results DTA (differential thermal analysis), DSC and TGA results for iron in the high temperature range:

You can clearly see the Curie Point at 770ºC, then the ferrite to austenite transition and finally the austenite to delta ferrite transition. For metals, this is important because you need to establish material behavior when welding (a high temperature activity!), and as the material property changes so much with carbon content, you can run a scan to predict what phase the material will be at the weld temperature to predict ease of welding and weld integrity.
Another example of high temperature DSC is evaluating melting points of metals like silver and copper, which is essential for circuit board performance analysis.
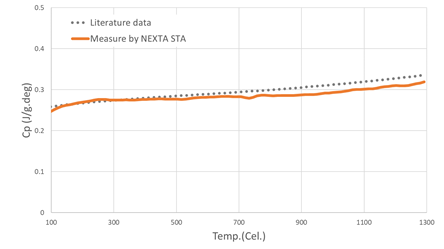
The NEXTA STA can also allow you to measure heat capacity analysis (Cp) at a higher temperature than a standalone DSC can do. Using modulated DSC our NEXTA STA can measure Cp from room temperature to 1500ºC.

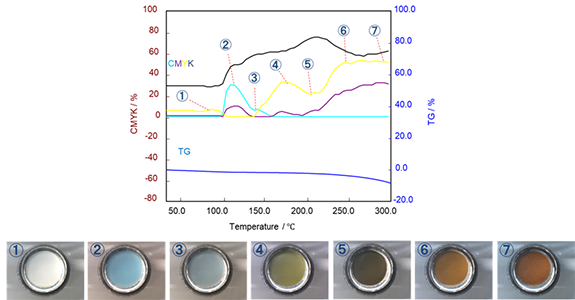
This combined with our RealView Camera which shows how the sample changes visually over time and temperature. Visually seeing dimension change and color measurement and help to troubleshoot any artefacts observed during STA experiments.

To have full analysis capabilities, many customers decide to purchase both a DSC and an STA, however the combined technique of the allows users to ascertain more information than a standalone TGA for every experiment, making it a very good analysis option.
The NEXTA STA combines TGA and DSC capabilities up to 1500 ºC delivering highly detailed thermal analyses in the way described above. World-class baseline performance with superior accuracy and precision gives reliable quantitative analysis, even on trace amounts of material. And our RealView camera system means you can watch the experiment in real time.
Find out more…
For more detail on the technical aspects covered in this post, including the use of STA for specific applications, such as food, cosmetics, pharmaceutical and petroleum quality control, please get in touch.
Get in touch