All OES analyzers contain three major components, the first is an electrical source to excite atoms within a metallic sample so that they emit characteristic light, or optical emission, lines – requires a small part of the sample to be heated to thousands of degrees Celsius. This is done using an electrical high voltage source in the spectrometer via an electrode. The difference in electrical potential between the sample and electrode produces an electrical discharge, this discharge passes through the sample, heating and vaporizing the material at the surface and exciting the atoms of the material, which then emits the element-characteristic emission lines.
Two forms of electrical discharge can be generated, either an arc which is an on/off event similar to a lightning strike, or a spark – a series of multi-discharge events where the voltage of the electrode is switched on and off. These two modes of operation are used depending on the element measured and the accuracy required.
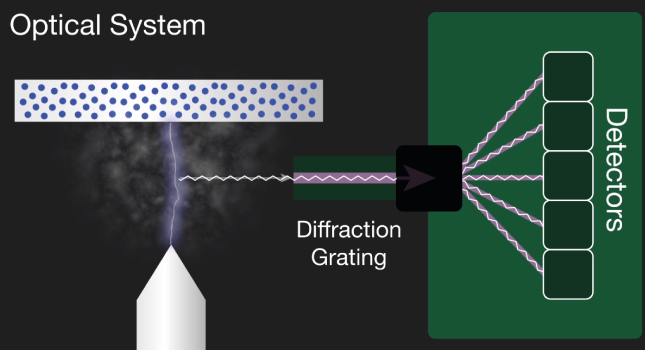
The second component is an optical system. The light, the multiple optical emission lines from the vaporized sample known as a plasma pass into the spectrometer. A diffraction grading in the spectrometer separates the incoming light into element-specific wavelengths and a corresponding detector measures the intensity of light for each wavelength. The intensity measured is proportional to the concentration offset element in the sample.
The third component is a computer system. The computer system acquires the measured intensities and processes this data via a predefined calibration to produce elemental concentrations. The user interface ensures minimal operator intervention with results clearly displayed which can be printed or stored for future reference.
So how do we generate element-specific optical emission lines from a metallic sample?
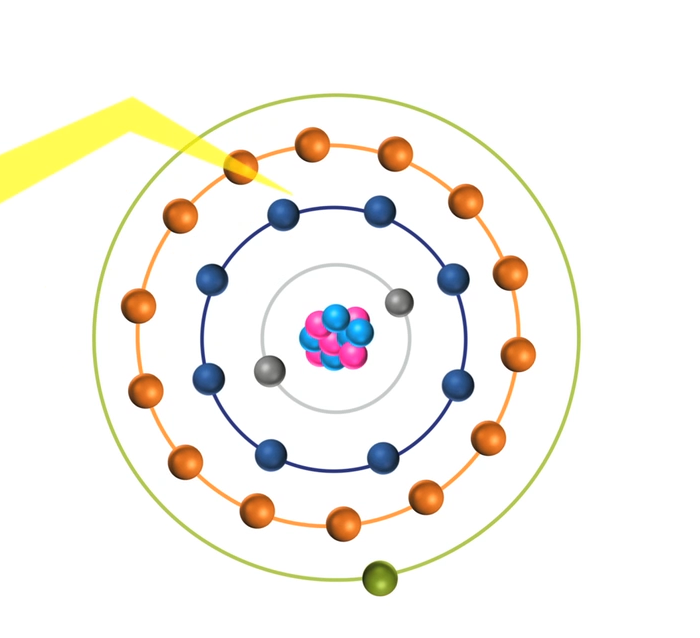
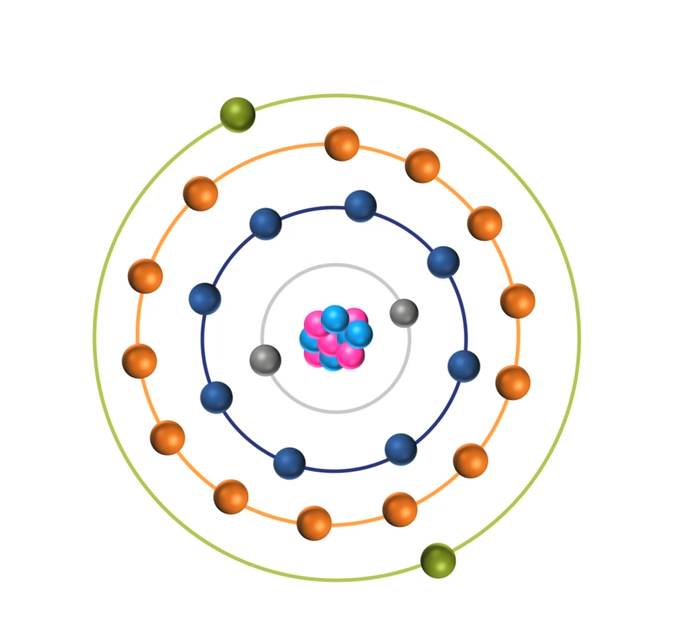
When the energy of an electrical discharge interacts with an atom, some of the electrons in the atom’s outer shells are ejected. Outer-shell electrons are less tightly bound to the nucleus of the atom because they are further away from the nucleus and so require less input energy to be ejected. The ejected electrons create a vacancy making the atom unstable.
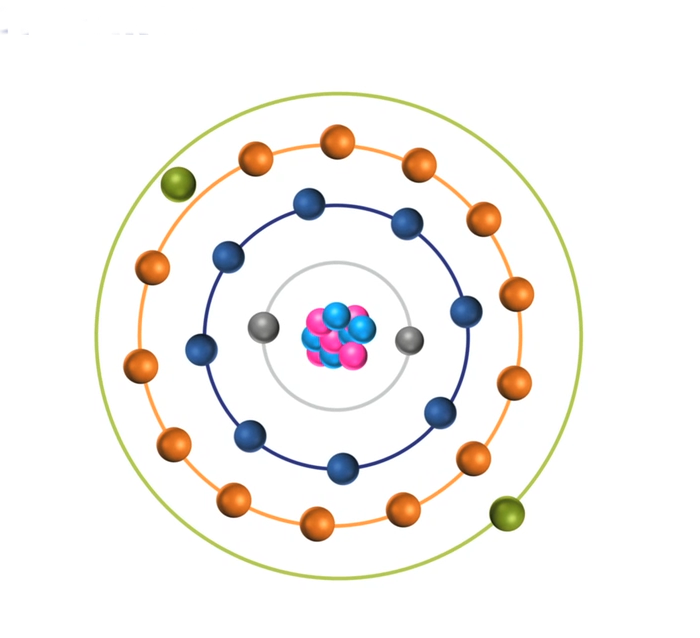
To restore stability, electrons from higher orbits further away from the nucleus drop down to fill the vacancy. The excess energy released as the electrons move between the two energy levels or shells is emitted in the form of element-specific light or optical emission.
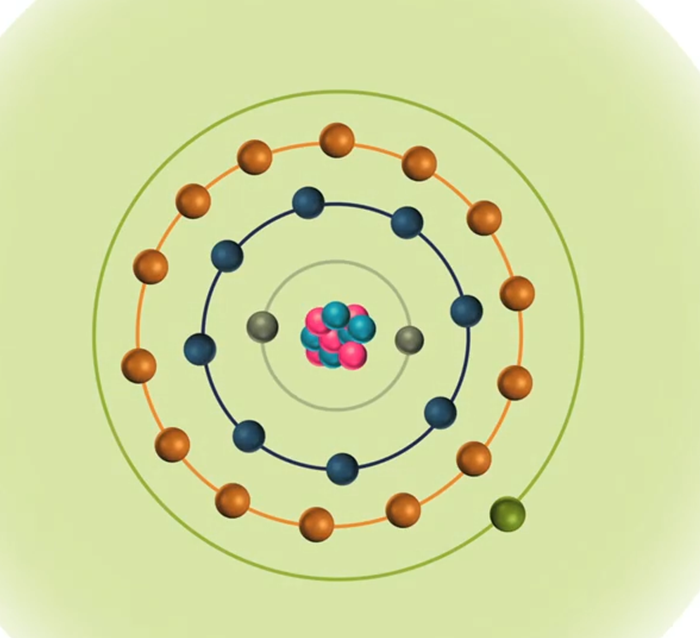
Every element emits a series of spectral lines corresponding to the different electron transitions between the different energy levels or shells. Each transition produces a specific optical emission line with a fixed wavelength or energy of radiation.
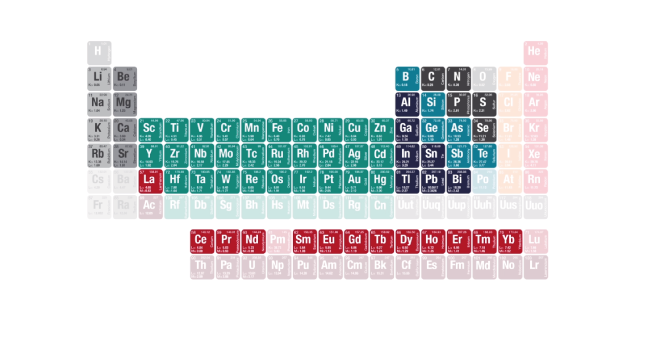
For a typical metallic sample containing iron, manganese, chromium, nickel, vanadium, etc., each element emits many wavelengths, leading to a line-rich spectrum. For example, iron emits just over 8000 different wavelengths so choosing the optimum emission line for a given element in a sample is important.
The characteristic light emitted by the atoms in the sample is transferred to the optical system where it is split into its spectral wavelengths by the high-tech grading, the grading contains up to 3600 grooves per millimeter.
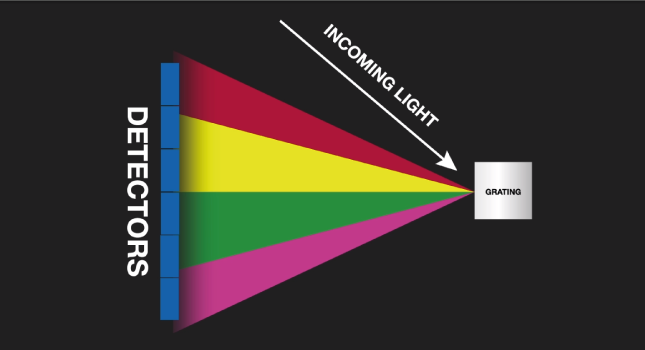
Next the individual spectral line peak signals are collected by detectors and processed to generate a spectrum showing the light intensity peaks versus their wavelengths. This means that OES provides qualitative information about the sample measured, however, OES is also a quantitative technique.
The peak wavelength identifies the element, and its peak area or intensity gives an indication of its quantity in the sample. The analyzer then uses this information to calculate the sample’s elemental composition based on a calibration with certified reference material. The whole process, from pressing a start button or a trigger to getting the analysis results, can be as quick as 3 seconds or it can take up to 30 seconds for a full accurate quantitative analysis, it all depends on the analyzer used, the range of elements measured and the concentrations of those elements.
Compared to other analytical techniques, OES has many advantages: it’s fast and relatively easy to use, it measures a wide range of elements and concentrations in many different types of materials, including important elements such as carbon, sulfur, phosphorous, boron and nitrogen. It’s extremely accurate when measuring low levels of trace and tramp elements, and it’s fairly low-cost compared to other techniques.
For trace analysis of metals OES is the preferred method, OES is also currently the only method which can analyze carbon and nitrogen on site, out of the laboratory.
Узнайте больше о наших OЭС инструментах